Neonatal General
Neonatal General 4: GI-Nutrition-Growth
676 - Measuring preterm infant nutritional status: A comparison of two body composition references
Saturday, April 29, 2023
3:30 PM - 6:00 PM ET
Poster Number: 676
Publication Number: 676.232
Publication Number: 676.232
Katherine A. Bell, Brigham and Women's Hospital, Boston, MA, United States; Sara Cherkerzian, Brigham and Women's Hospital, Boston, MA, United States; Hunter L. Pepin, Brigham and Women's Hospital, Boston, MA, United States; Anand Panigrahy, Brigham and Women's Hospital, Boston, MA, United States; Mandy Belfort, Brigham and Women's Hospital, Boston, MA, United States

Katherine A. Bell, MD (she/her/hers)
Instructor of Pediatrics
Brigham and Women's Hospital
Boston, Massachusetts, United States
Presenting Author(s)
Background: Fat-free mass (FFM) at term equivalent age (TEA) is an important nutritional status indicator among preterm infants because low FFM correlates with impaired brain development. Additionally, excess fat in infancy may contribute to later obesity and related complications. In order to classify FFM, fat mass, and body fat percent (BF%), a preterm infant at TEA is compared with a term newborn of the same postmenstrual age (PMA) using one of two charts: 1) INTERGROWTH—a body composition standard derived from a highly selected healthy population, or 2) Norris—a reference derived from a convenience sample of newborns. The extent to which classification of body composition differs when using the healthy standard (INTERGROWTH) vs the reference (Norris) is unknown.
Objective: To compare the classification of FFM, fat mass, and BF% among very preterm infants at TEA using INTERGROWTH standard vs Norris reference.
Design/Methods: We studied 110 infants born < 33 weeks’ gestation. Body composition was measured by air displacement plethysmography at 38.0-42.1 weeks PMA. We classified each infant’s FFM, fat mass, and BF% into one of five categories (< 3rd percentile, 3-< 10%ile, 10-< 90%ile, 90-< 97%ile, ≥97%ile) using both INTERGROWTH and Norris charts. We defined low FFM as < 10%ile (bottom 2 categories) and excess adiposity as >90%ile (top 2 categories). We compared agreement between the categories assigned by the two charts using percent agreement and kappa (κ) statistic.
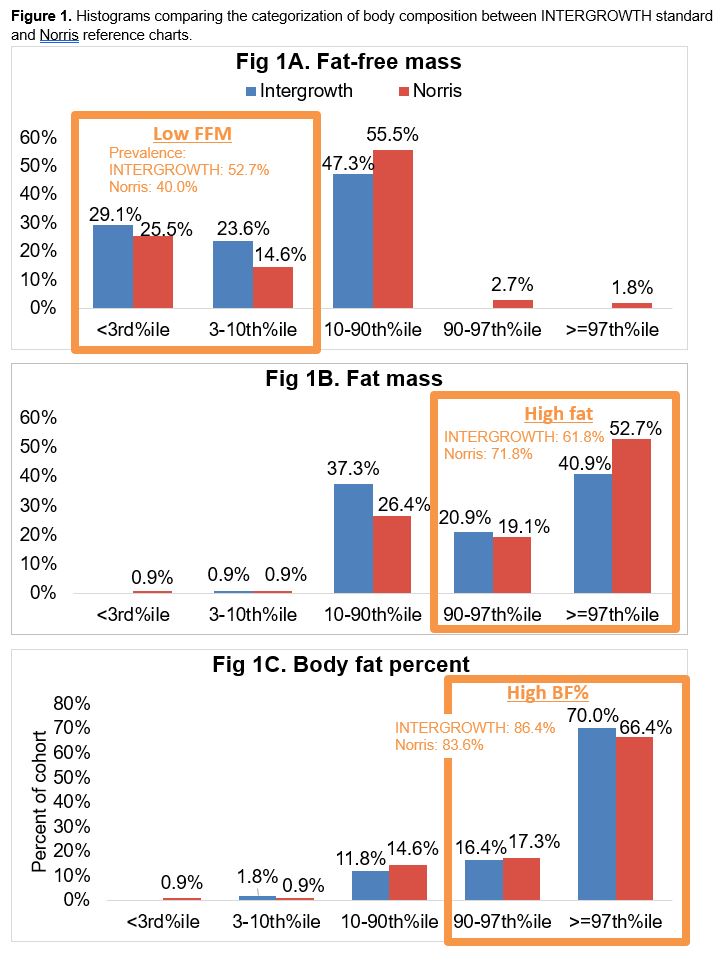
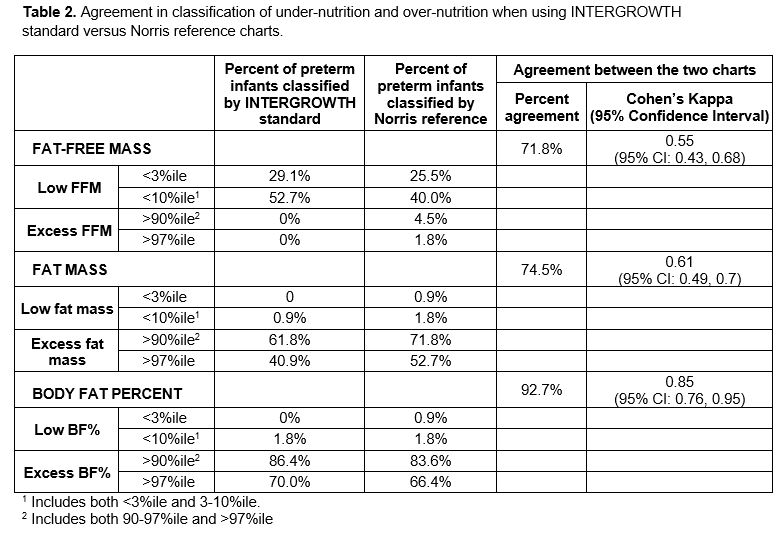
Results: Mean gestational age was 28.3 ± 2.3 weeks; 57% were male (Table 1). Using the INTERGROWTH standard to compare with full-term infants, preterm infants frequently had low FFM and excess fat; the prevalence of low FFM was 52.7% and prevalence of excess adiposity was 61.8% for fat mass, 86.4% for BF% (Fig 1). Compared with INTERGROWTH, Norris classified fewer infants as having low FFM (Table 2). Agreement between INTERGROWTH and Norris was moderate for FFM (κ=0.55, 95%CI:0.43-0.68) and fat mass (κ=0.61, 95%CI:0.49-0.72), higher for BF% (κ=0.85, 95%CI:0.76-0.95) (Table 2).
Conclusion(s): Preterm infants at TEA had lower FFM and higher adiposity compared with reference data from full-term newborns of the same PMA. Relative to the INTERGROWTH standard, Norris classified fewer infants as having low FFM; thus, Norris may underestimate the prevalence and degree of malnutrition, which is relevant for identifying infants at risk for nutrition-related complications including neurodevelopmental impairment. Future studies are needed to determine which reference best predicts later developmental and health outcomes.
.jpg)


