Quality Improvement/Patient Safety: All Areas
QI 4: Inpatient QI/Patient Safety
236 - Utilization of an Interactive Dashboard to support transparency of Hospital Acquired Condition Data in the Microsystems
Publication Number: 236.45

Sangeeta K. Schroeder, MD MHQS (she/her/hers)
Medical Director, Center for Quality and Safety
Ann & Robert H. Lurie Children's Hospital of Chicago
Chicago, Illinois, United States
Presenting Author(s)
Background:
Hospital level Hospital Acquired Condition (HAC) data includes several standardized metrics, often defined as an aggregated safety index, at many pediatric centers. While hospital level data is useful for monitoring outcomes, improvement is strengthened by dynamic interaction with both summative and detailed data.
Objective:
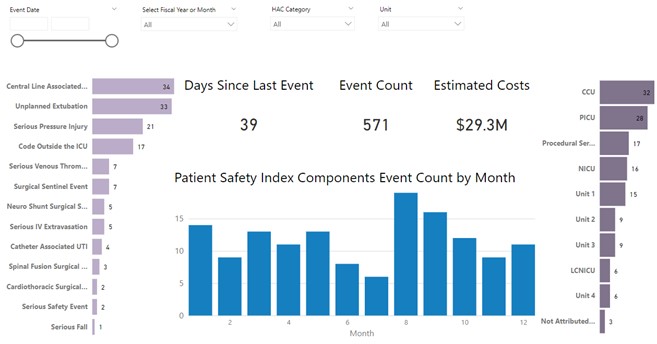
We aimed to replace our current hospital level safety dashboard with an interactive, HAC specific dashboard to garner continuous improvement without adding to the burden of clinical leaders.
Design/Methods:
HAC leadership and Data Analytics & Reporting (DAR) created a system that integrated the collection of patient data over multiple years from multiple sources (ex. medical record, SQL database, VigilanzR) used by clinical experts completing case reviews into a central database. This multiyear database associated each harm event with a patient MRN, along with multiple other discrete fields (ex. patient location, race, ethnicity, language). DAR created the interactive and dynamic dashboard to replace the existing static data display. This also allows improvement team members to filter to patient identifiable data for easier analysis and identification of improvements. Microsystem leadership were encouraged to utilize these dashboards during unit huddles and safety rounding.
Results:
An interactive Patient Safety Index with multi-year HAC data was implemented in 9/2022. There were 5,557 site visits to the dashboard from 9/2022 – 11/2022. Since initial implementation of the prior dashboard in 1/2021, there have been 38,827 site visits and 1,597 unique viewers. The number of days from 9/2022 – 11/2022 that had more than 50 site visits/day increased from 23 (9/2021 – 11/2021) to 56. There were 18 days in the same period that had more than 100 site visits/day, compared to 8 in the previous year.
Conclusion(s):
Our interactive dashboard has simplified access to reliable data which both supports robust analyses and automates visualization of relevant findings used by clinical teams. Improvement is guided by having easy access to unit-specific trends. Case review by clinical experts is a manual task but by leveraging integration and automation, we have shifted the effort of clinical experts toward more data interpretation and improvement. In addition, while integrating with clinical case review data, we have expanded opportunity to reveal new understanding of relationships between factors not previously studied across multiple event types including but not limited to health equity, patients with multiple harm events, costs and risks associated with the complex pediatric care.
e. 
.jpg)
.jpg)
